
 NL
NL  DE
DE 
Trying to figure out if you're getting a good price on your intraday trades can be tough, leaving you to guess if you overpaid. This article explains how to use the Volume-Weighted Average Price (VWAP) indicator to find a stock's "fair value" for the day. You'll learn what VWAP is, how it works, and a few practical strategies to apply it to your trading.
Simply put, VWAP is the true average price an asset has traded at throughout the day, based on both price and volume. Think of it as the market’s real-time consensus on fair value for that specific trading session. This makes it a powerful, dynamic level for identifying potential support or resistance.
What Is VWAP and Why Does It Matter?
If you’ve ever bought a stock and immediately wondered if you overpaid, VWAP gives you a solid reference point. Unlike a simple moving average that just crunches price data, VWAP gives more weight to the price levels where the most shares actually changed hands. This is crucial because it shows where the market has the most conviction.
A price trading above the VWAP line generally suggests bullish strength for the day. Conversely, a price trading below VWAP often points to bearish pressure. All trading involves risk, and VWAP is an analytical tool, not a crystal ball.
Let’s use an analogy. Imagine a bustling farmers' market. A few tomatoes might sell for a high price first thing in the morning, and a few might go for a steep discount right before closing. But the bulk of the sales—where most of the money was actually spent—happened around a specific average price during the busiest part of the day.
VWAP is like that peak-hour average price. It shows you where the most significant trading activity happened, cutting through the noise of low-volume price spikes. For a deeper dive into similar tools, you can explore more concepts in our guide to technical analysis trading tips.
VWAP at a Glance: Key Characteristics
This table breaks down the essential features of the VWAP indicator, highlighting its primary function and why it’s so valuable for traders.
| Characteristic | Description | Why It Matters for Traders |
|---|---|---|
| Volume-Weighted | Calculation incorporates both price and volume for every transaction. | Gives more significance to price levels with heavy trading, reflecting the "true" market consensus. |
| Intraday Focus | Resets at the start of each new trading session (e.g., daily). | Perfect for day traders looking for a benchmark that is relevant only to the current day's action. |
| Cumulative Average | The value is a running total, accumulating data from the session's open. | The line becomes more stable and less reactive to small price moves as the day progresses. |
| Single Line | Typically displayed as a single, continuous line on a chart. | Provides a clear, unambiguous reference point for fair value, support, and resistance. |
Understanding these core traits is the first step toward effectively using VWAP in your own trading.
The Institutional Benchmark
VWAP became a crucial tool for institutional investors in the 1990s. They needed a way to execute massive orders without single-handedly moving the market and getting bad prices. Today, it’s a standard for pension funds, mutual funds, and hedge funds.
Some research suggests that 70-80% of institutional traders reference VWAP in their daily execution strategies, especially for large block trades. You can read more about VWAP's institutional role from sources like the Corporate Finance Institute.
Because large institutions use VWAP to measure their own performance—aiming to buy below it and sell above it—their massive order flow often creates natural support or resistance right at the VWAP line. This creates a sort of self-fulfilling prophecy that retail traders can watch for and potentially act on.
In essence, VWAP cuts through the noise of random price fluctuations to reveal the price level that the market, as a whole, has agreed upon for the day. It represents the point of financial equilibrium where the bulk of transactions have occurred.
A Practical Breakdown of How VWAP Is Calculated
Knowing what VWAP is telling you is one thing, but understanding how it's calculated gives you a real edge. You don't need to be a math expert to get it; the logic is straightforward and shows why volume is the secret ingredient that makes this indicator so powerful.
Think of it as a three-step process that repeats and builds on itself throughout the trading day.
The infographic below gives you a quick visual of how simple price and volume data come together to form the VWAP line.
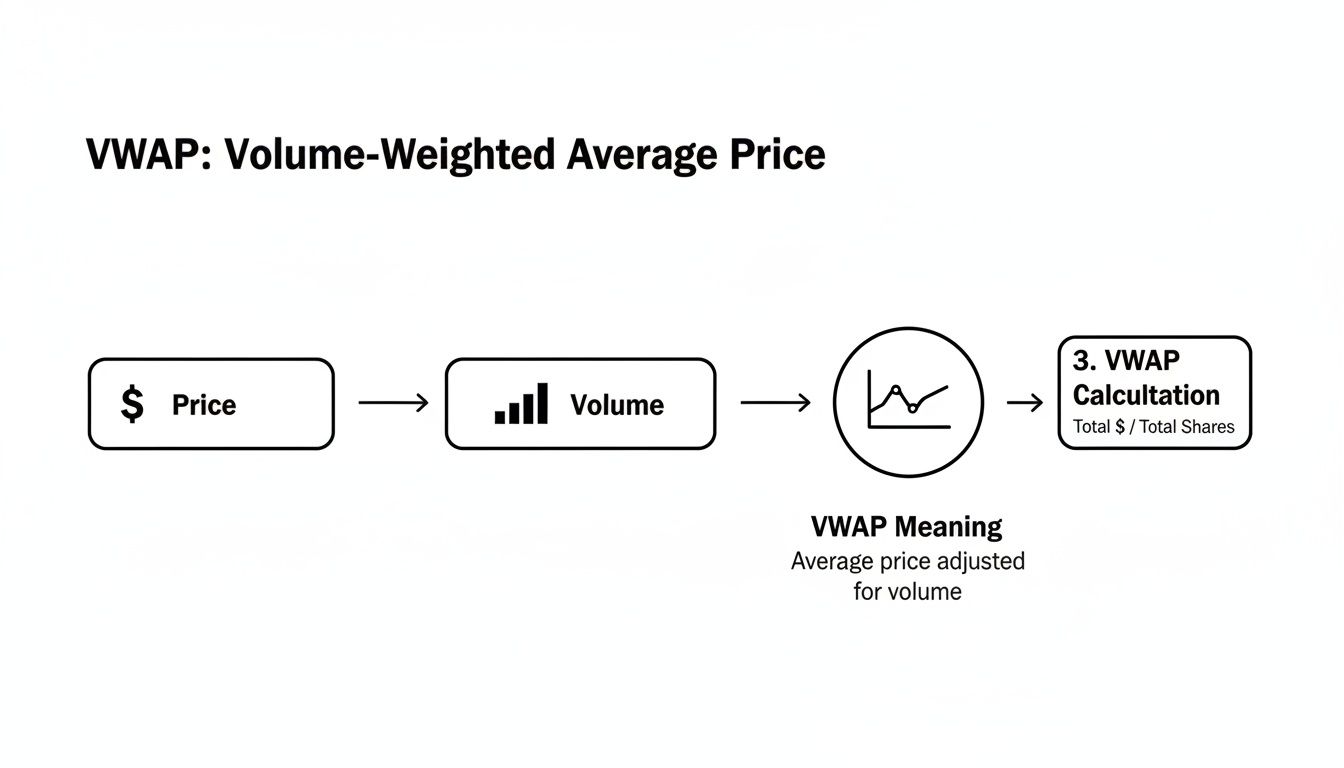
This really drives home the point: VWAP isn’t just an average price. It’s an average weighted by conviction, and in the market, conviction is measured by volume.
The Three Steps of the VWAP Formula
One of the most important things to remember is that the VWAP calculation starts fresh every single trading day. It’s a purely intraday indicator that gets more reliable as the session goes on and more trades are factored in.
Here’s a step-by-step breakdown:
-
Find the "Typical Price" for the Period: First, for your chosen timeframe (e.g., 1-minute, 5-minute), the system calculates a Typical Price. The formula is (High + Low + Close) / 3. It’s a quick way to get a balanced, representative price for that candle.
-
Multiply by Volume: Next, that Typical Price is multiplied by the total volume traded during that same period. This step gives massive importance to price levels where big players were active. A price level where 100,000 shares traded will have 100 times the impact on VWAP as a level where only 1,000 shares changed hands.
-
Keep a Running Total: Finally, the indicator maintains a running total of these "Price x Volume" values and divides it by the cumulative total volume for the day so far. The full formula looks like this: VWAP = Cumulative (Typical Price x Volume) / Cumulative Volume.
This cumulative process is why VWAP can be a bit choppy at the market open but tends to smooth out and become a more reliable anchor as the day progresses.
A Quick Numerical Example
Let's use a concrete example. The math behind VWAP crunches data from small timeframes like 1, 5, or 15-minute intervals, starting from the opening bell.
Imagine a stock over a 3-minute period:
- Minute 1: Typical Price = $100.10, Volume = 500 shares. (Value = $50,050)
- Minute 2: Typical Price = $100.20, Volume = 1,500 shares. (Value = $150,300)
- Minute 3: Typical Price = $100.15, Volume = 700 shares. (Value = $70,105)
To calculate the VWAP at the end of minute 3:
- Total Value: $50,050 + $150,300 + $70,105 = $270,455
- Total Volume: 500 + 1,500 + 700 = 2,700 shares
- VWAP: $270,455 / 2,700 = $100.17
Notice how the high-volume second minute pulled the VWAP up. For a more detailed look at the math, Investing.com has a good breakdown of the VWAP formula.
Actionable VWAP Trading Strategies for Day Traders
Now that you know what VWAP is and how it’s calculated, let's get into actually using it to trade. Remember, no strategy is foolproof, and trading always involves the risk of loss. These examples are educational frameworks, not financial advice.
Strategy 1: The VWAP Mean Reversion
This strategy is based on the concept of mean reversion. The core idea is that price, after stretching too far away from the VWAP line, will eventually revert toward this "fair value" zone. This approach tends to work best in markets that are range-bound or in a gentle trend.
Entry Checklist:
- For Long Trades:
- The price must be trading significantly below the VWAP.
- Look for a bullish reversal signal, like a hammer or engulfing candlestick pattern.
- Enter the trade once the reversal pattern is confirmed.
- For Short Trades:
- The price must be trading significantly above the VWAP.
- Look for a bearish reversal signal.
- Enter the trade once the bearish pattern is confirmed.
Risk Management:
- Stop-Loss: Place your stop-loss just outside the reversal candle's extreme (e.g., below the low of a hammer for a long trade).
- Profit Target: A logical first profit target is the VWAP line itself. Some traders might close part of their position there and let the rest run.
Strategy 2: VWAP Breakout and Confirmation
When a market is trending strongly, VWAP acts more like a dynamic support or resistance level. A clean, decisive break of this level can signal that a powerful new intraday trend is starting. This strategy is built to catch those sustained moves.
The key here is a shift in mindset. We're not betting on a return to VWAP. We're using a break of VWAP as our confirmation that institutional money is pushing the price in a new direction.
Knowing how to combine indicators is crucial for building a robust system. To go deeper, you can learn more about how to create a forex strategy based on technical analysis.
Entry Checklist:
- Bullish Breakout (Long):
- Price breaks above the VWAP with a strong candle, ideally on a spike in volume.
- Wait for a subsequent candle to hold above the VWAP, confirming it as new support.
- Enter the trade on the confirmation.
- Bearish Breakout (Short):
- Price breaks below VWAP with conviction.
- Wait for a retest where price fails to get back above VWAP, confirming it as new resistance.
- Enter the trade on the confirmation.
Risk Management:
- Stop-Loss: Place your stop on the other side of the VWAP line. For a long trade, your stop would be set just below VWAP.
- Profit Target: Aim for a solid risk-to-reward ratio, like 1:1.5 or 1:2, or target a major price level from a higher timeframe.
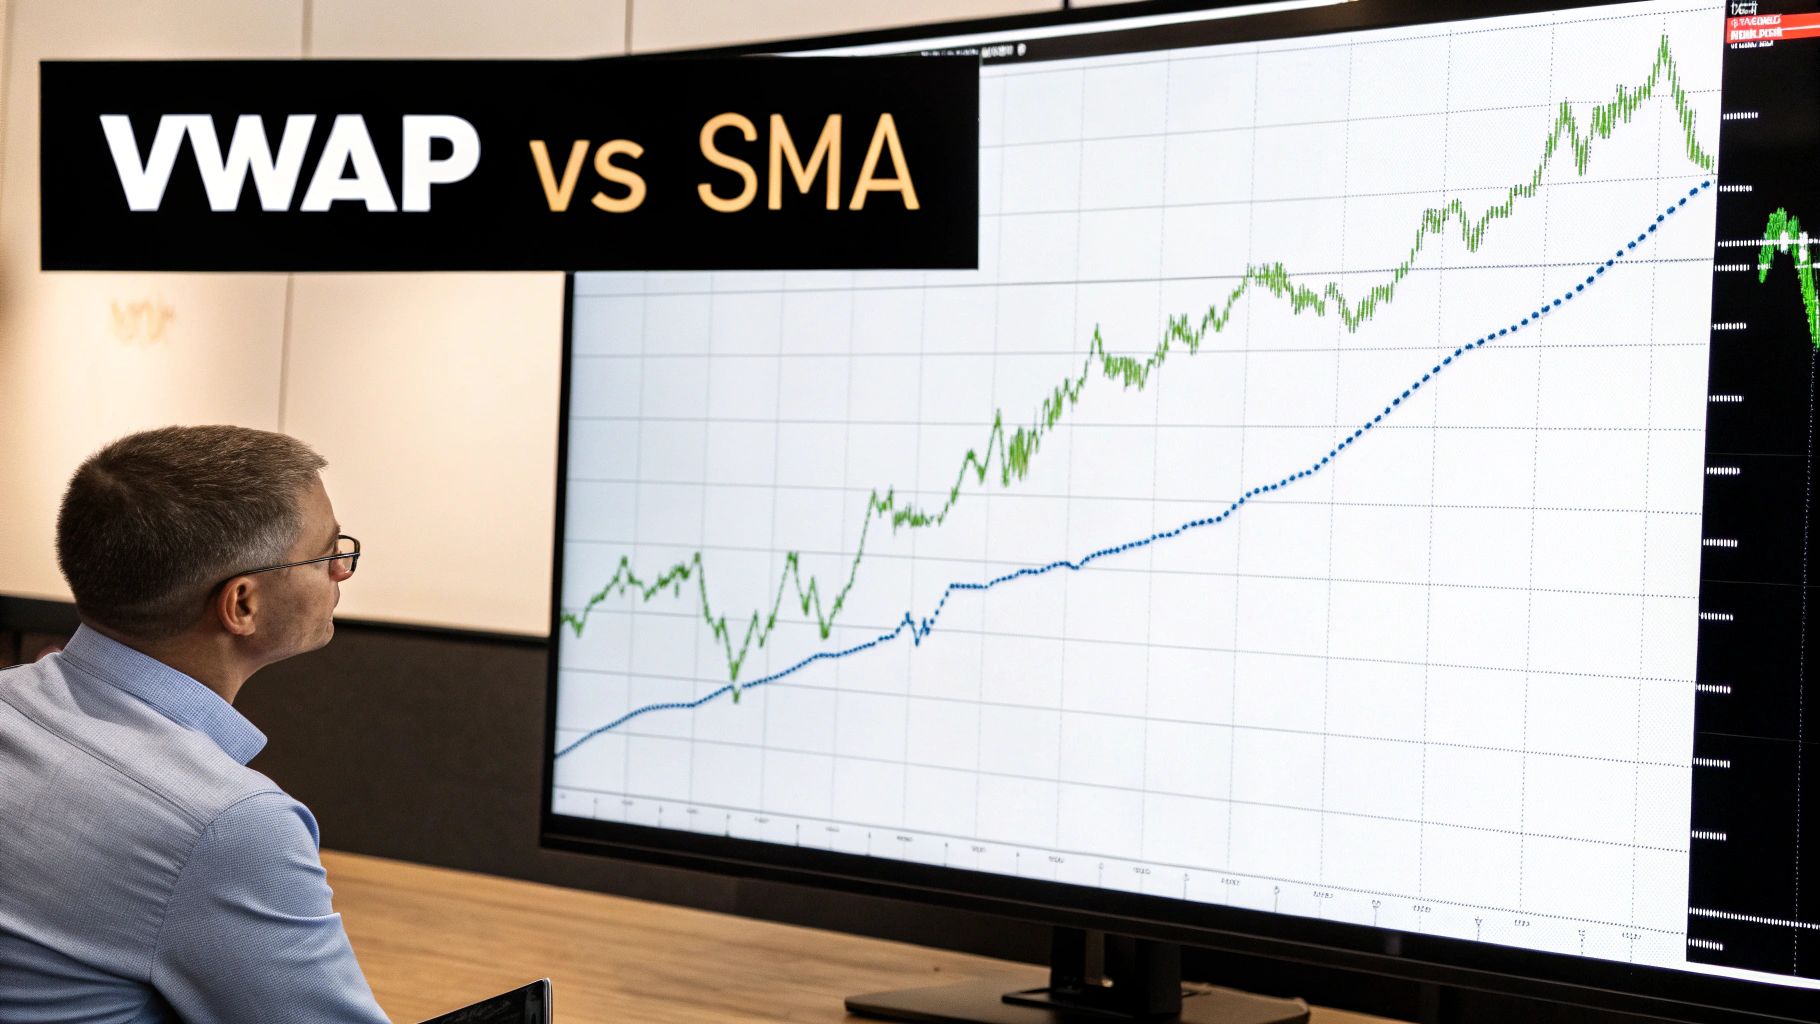
VWAP Versus Moving Averages: Which Tool Should You Use?
At first glance, VWAP looks a lot like a moving average. They both appear as a single, curving line on your chart. However, they are fundamentally different because of one key ingredient: volume.
A Simple Moving Average (SMA) only cares about price. It adds up the closing prices over a set period—say, 20 candles—and divides by 20. It doesn't matter if one share traded or a million shares traded; every candle gets an equal vote.
VWAP, however, is volume-weighted. It gives far more significance to price levels where big money was moving. This gives you a much truer picture of an asset’s average price.
The Core Difference: Volume Weighting
Here's a simple way to think about it: an SMA tells you the average price, but VWAP tells you the average price paid. It reveals the market’s real consensus on fair value. This is why institutions use it. Their algorithms are often programmed to buy below VWAP and sell above it, which can make the VWAP line a self-fulfilling prophecy.
A Simple Moving Average answers, "What's the average closing price over the last X candles?" VWAP answers a more powerful question: "Where did the most shares trade hands today?" That distinction is everything for intraday analysis.
This means they are built for different jobs. An SMA is great for spotting longer-term trends. VWAP is a specialist for intraday analysis, resetting every morning.
VWAP vs. Simple Moving Average (SMA) Key Differences
So, which one should you use? It depends on your trading style. One isn't "better" than the other; they are different tools for different tasks.
| Feature | VWAP (Volume-Weighted Average Price) | SMA (Simple Moving Average) |
|---|---|---|
| Calculation Basis | Incorporates both price and volume data. | Based solely on price data (typically closing prices). |
| Primary Timeframe | Strictly intraday; resets at the start of each new trading session. | Flexible; can be used on any timeframe (minutes, days, weeks). |
| Main Use Case | Identifies the "fair value" for the current day; acts as a benchmark for entries and exits. | Smooths out price action to identify the direction and strength of a trend over a set period. |
| Best For | Day traders seeking intraday support/resistance and institutional benchmarks. | Swing traders and trend followers analyzing momentum over multiple sessions. |
Many experienced traders use both. They might use VWAP on a 5-minute chart for entries and exits, while keeping a 50-day SMA on the daily chart to stay aligned with the bigger picture.
Common VWAP Mistakes to Avoid
Knowing how to use VWAP is one thing, but knowing how not to use it is just as important. Avoiding these common pitfalls can protect your strategy from simple, costly errors.
Mistake 1: Using VWAP on Low-Volume Stocks
The whole point of VWAP is that it's weighted by volume. If you apply it to a stock that barely trades, the indicator becomes unreliable. On a thinly-traded asset, just a few small orders can swing the VWAP line wildly, giving you a distorted picture of value.
- How to fix it: Stick to liquid assets. VWAP works best on major indices, popular large-cap stocks, and high-volume futures where the volume data is meaningful.
Mistake 2: Applying VWAP to Long Timeframes
VWAP is an intraday indicator, period. Its calculation resets every morning. Using the daily VWAP on a weekly or monthly chart makes no sense because the context is gone. VWAP is designed to benchmark today's session, not a long-term trend.
- How to fix it: Keep VWAP on your intraday charts (1-minute, 5-minute, 15-minute). For longer-term analysis, use tools like a 20-day or 50-day simple moving average.
Mistake 3: Blindly Trusting VWAP as a Reversal Point
A common mistake is to see the price touch the VWAP line and immediately place a trade, expecting a perfect bounce. While VWAP often acts as support or resistance, it is not an unbreakable barrier. A strong trend will slice right through it.
VWAP is not a signal; it's a reference point. It tells you where the market has been, not where it's definitely going. Think of it as an area of interest where a reaction is likely, not guaranteed.
- How to fix it: Always look for confluence before taking a trade. Does price action confirm the level with a bullish engulfing candle? Does another indicator support your thesis? Never take a trade based on VWAP alone.
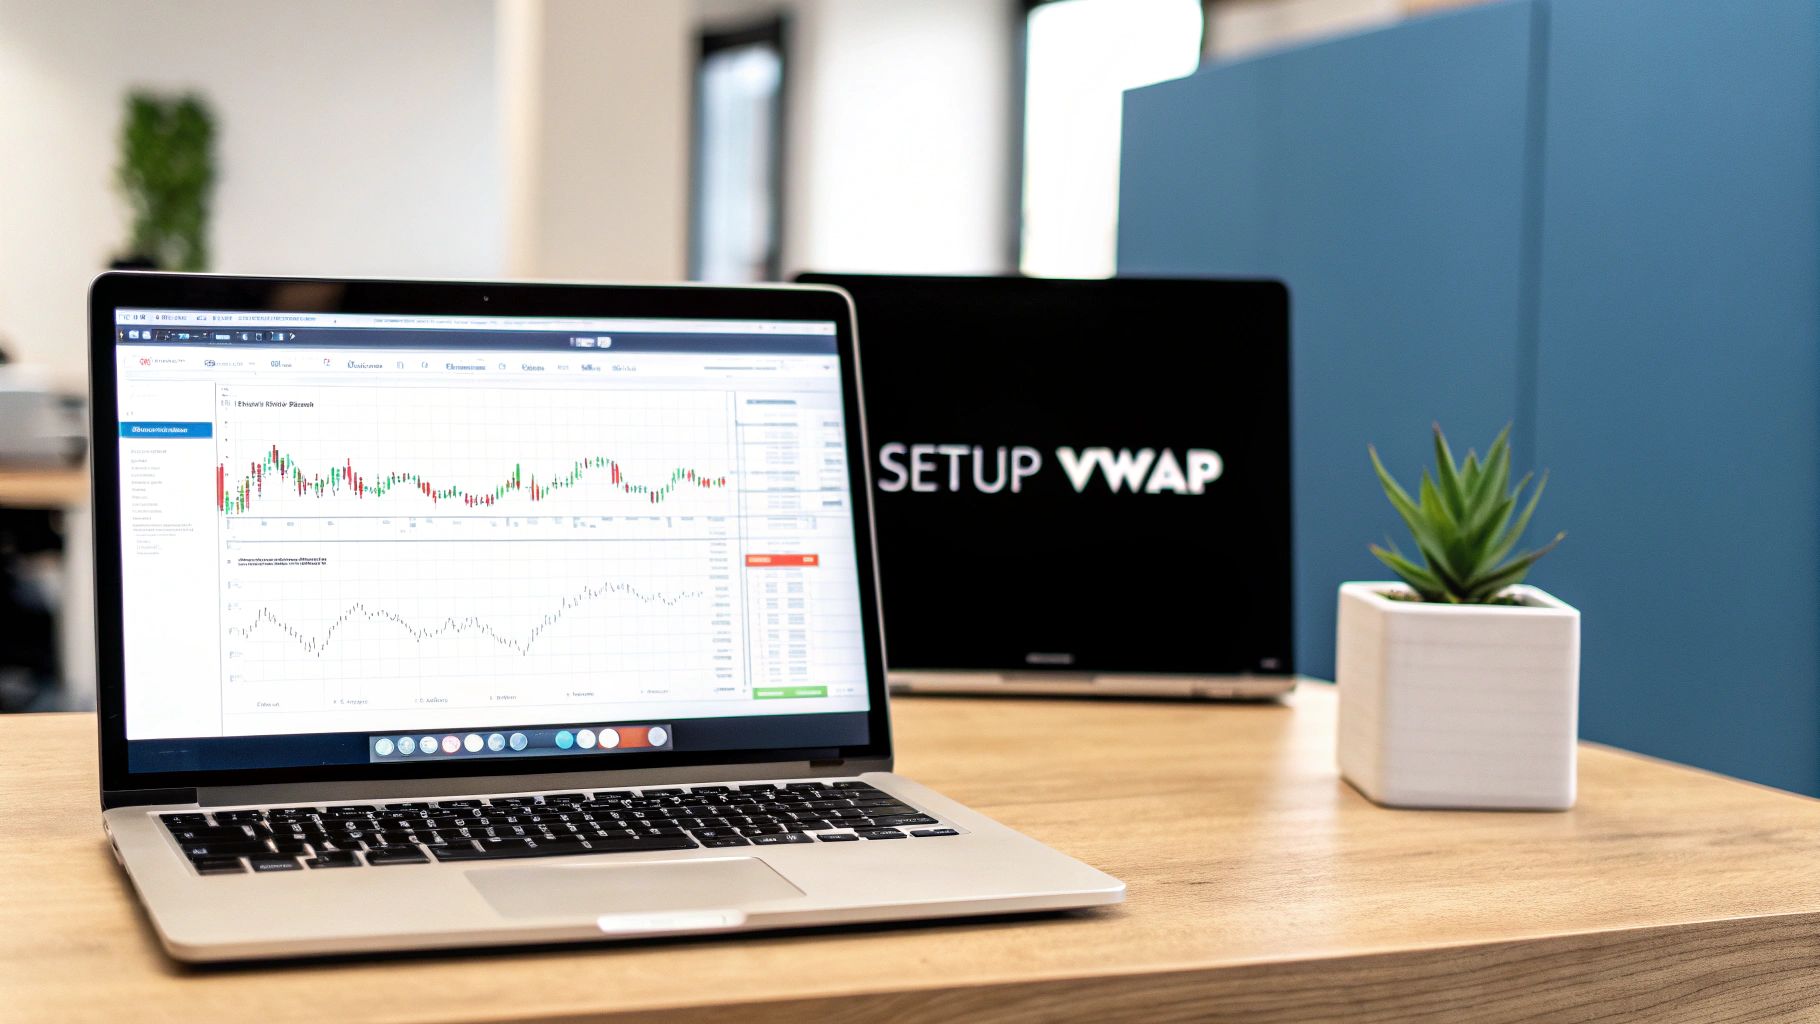
Setting Up VWAP on Your Trading Platform
Adding the VWAP indicator to your charts is simple on most modern trading platforms. It’s usually a standard, built-in tool.
First, find the indicators library on your charting software. Whether you're on TradingView, cTrader, or another platform, look for a button labeled "Indicators" or "Studies." Click it and type "VWAP" into the search bar.
Once selected, the Volume-Weighted Average Price line will appear on your chart.
Customizing Your VWAP Indicator
Most platforms allow you to make the VWAP more powerful by adding standard deviation bands. These bands create a channel around the main VWAP line that helps you spot when a price might be overextended.
A common setup is to add one or two standard deviation bands. When the price touches the top band, it’s often seen as overbought. When it hits the bottom band, it might be considered oversold.
To turn on the bands, follow these steps:
- Open the indicator's settings (look for a gear icon or right-click the VWAP line).
- Find the "Inputs" or "Style" tab.
- Check the boxes for the "Upper Band" and "Lower Band."
- You can also adjust the multiplier for wider or tighter channels (the default is typically 1.0).
These options are standard on most platforms. To confirm what’s available, check the features on your trading platform.
Frequently Asked Questions (FAQ)
Here are answers to some common questions traders have about VWAP.
Can I Use VWAP For Swing Trading?
Not the standard version. Classic VWAP is an intraday tool because its calculation resets every morning, making it irrelevant for trades held overnight. For swing trading, moving averages like the 20-day or 50-day SMA are more appropriate. An exception is the Anchored VWAP, which can be started from a specific date (like an earnings report) and used over longer periods.
What Are VWAP Bands and How Do I Use Them?
VWAP bands are standard deviation lines drawn above and below the main VWAP line, similar to Bollinger Bands. They act as volatility channels. When the price touches the upper band, it may be overbought, offering a potential short setup. A bounce off the lower band can signal an oversold condition, offering a potential long entry.
Does VWAP Work For Crypto and Forex Markets?
It can, but with a major caveat. VWAP relies on accurate, centralized volume data, which is available for stocks and futures. Forex and crypto markets are decentralized, meaning volume data is fragmented across many exchanges. The volume on your chart might only be from one source, not the entire market. So, while you can plot VWAP on a BTC or EUR/USD chart, its reading may not be a true reflection of the market-wide average price.
Ready to put your knowledge to the test? At MyFundedCapital, we provide the capital and platform for skilled traders to succeed. This content is for educational purposes only and is not financial advice. All trading involves risk.