
 NL
NL  EN
EN 
Confused by unpredictable market swings and strategies that seem to stop working? Auction Market Theory offers a logical framework to understand why the market moves the way it does, framing it as a continuous auction. This guide will show you how to read market structure, identify high-probability zones, and build a more consistent trading plan.
Why Market Predictions Fail (And What to Do About It)
Most traders try to predict where the price will go next, leading to chasing trends and getting caught in reversals. This is often a losing game because markets are too complex for consistently accurate predictions. Auction Market Theory (AMT) offers a more practical approach by shifting the focus from prediction to observation.
Instead of asking, "Where is the price going?" AMT asks, "Where has the market found value?" It treats the market as a simple two-way auction:
- Buyers bid prices up looking for sellers.
- Sellers offer prices down looking for buyers.
This process eventually reveals a price zone where both sides agree on a "fair" price, which is where most trading volume occurs. By identifying this area, you can map the market's underlying structure instead of just guessing its next move. This mindset is crucial for navigating the strict risk rules of a funded account.
The Reality of Market Behavior
Data shows that markets spend the vast majority of their time in balance or consolidation. Trader Jan Firich's analysis revealed that markets are in a clear, directional trend only about 9.5% of the time. This means that most trend-following strategies are designed for a market condition that rarely occurs.
By adopting an auction perspective, you stop acting like a fortune teller and start observing where the market is building value. This helps you identify where price is likely to find acceptance or rejection, a key skill for building strategies that can adapt to changing market conditions. For more on this, see our guide on why some trading strategies stop working over time.
Decoding the Market's Language: Market Profile and Volume Profile
To apply Auction Market Theory, you need the right tools. The Market Profile and Volume Profile act like an x-ray of the market, showing you where trading activity happened and with how much conviction. They help you decode the collective behavior of all market participants.
This flowchart illustrates the core idea: shifting from prediction to understanding the auction process that creates value.
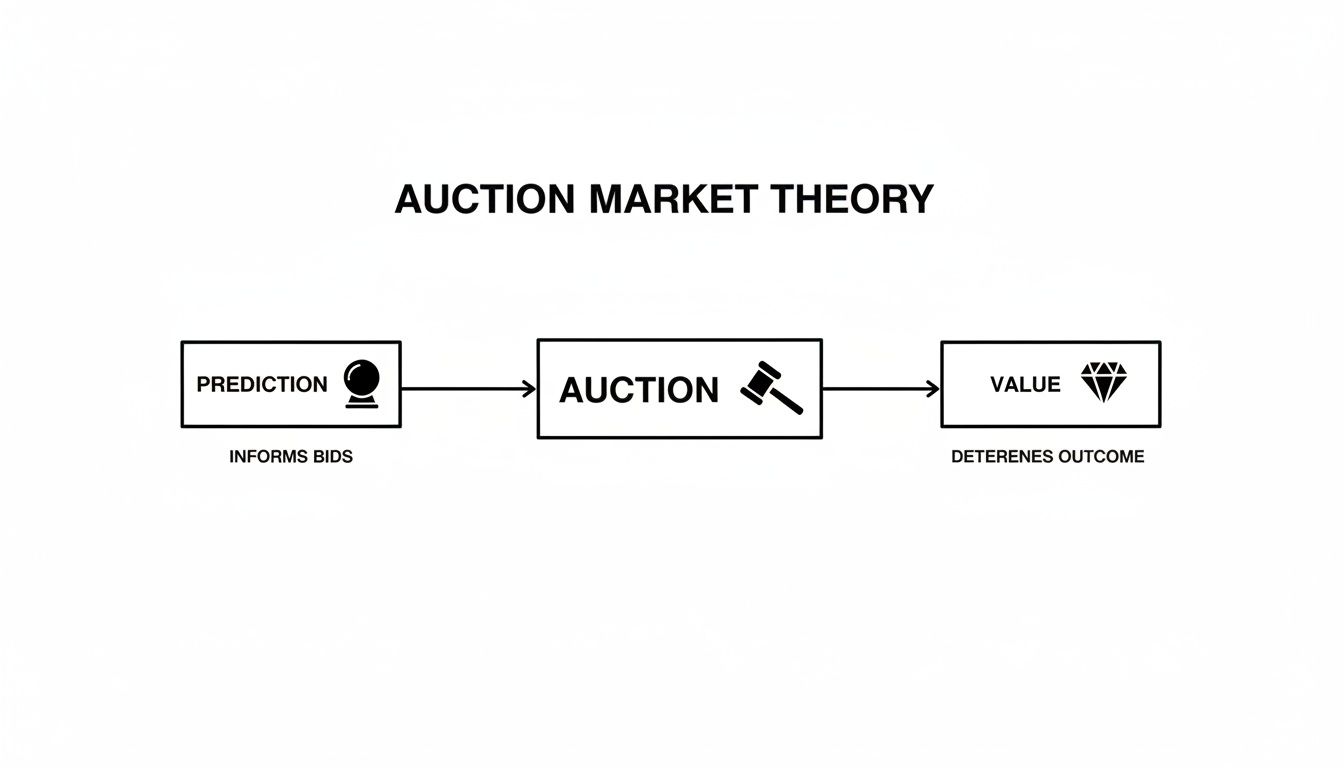
The goal is not to predict the future but to read the auction as it unfolds and identify where the market perceives fair value right now.
Key Concepts You Must Know
To understand the profiles, you need to know a few key terms. These concepts represent where buyers and sellers found common ground.
- Point of Control (POC): The single price level with the most traded volume. This is considered the "fairest" price for the session.
- Value Area (VA): The price range where approximately 70% of the session's volume was traded. This is the zone of highest activity and agreement.
- Value Area High (VAH): The upper boundary of the Value Area. Prices above the VAH are seen as relatively expensive.
- Value Area Low (VAL): The lower boundary of the Value Area. Prices below the VAL are considered relatively cheap.
The Value Area isn't a rigid support/resistance box; it’s a dynamic zone. The real trading insights come from observing how price behaves as it approaches, leaves, or returns to this area.
Market Profile vs. Volume Profile
These two tools look similar but measure different things.
- Market Profile: Organizes price based on time. It uses symbols (TPOs) to show how long the price spent at each level, focusing on the auction's structure and duration.
- Volume Profile: Organizes price based on volume. It shows the exact number of shares or contracts traded at each price level, highlighting where the most commitment and conviction occurred.
Many traders use both to get a complete picture. Volume Profile can confirm the high-activity areas suggested by the Market Profile's structure. Other volume-based tools can also help; you can learn about the Volume Weighted Average Price (VWAP) in our detailed guide.
Reading the Daily Market Narrative
Every trading session tells a story of the battle between buyers and sellers. Applying Auction Market Theory allows you to read that story in real-time by identifying "day types" based on the Market Profile's structure. This helps you adapt your strategy to the current market environment.

Understanding the shape of the daily profile gives you insight into whether the market is balanced or actively searching for a new price level. This skill is critical for setting realistic expectations and protecting your capital.
Understanding the Initial Balance (IB)
The Initial Balance (IB) is the price range established during the first hour of the trading session. It sets the stage for the day and provides a reference point for market behavior. How price acts around the IB for the rest of the day reveals who is in control: buyers, sellers, or neither.
Common Day Types and What They Mean
By observing how the market develops relative to the Initial Balance, we can categorize the session into a few key day types.
Normal Day
A Normal Day is a balanced market. Price establishes an Initial Balance and generally stays within that range. It indicates that buyers and sellers have agreed on a fair price, and neither side has enough conviction to push the market significantly.
- Characteristics: Wide, symmetrical profile shaped like a bell curve.
- What it means for you: Ideal for mean-reversion strategies. Fading the edges of the Value Area or the IB extremes can be effective. Avoid chasing breakouts.
Trend Day
A Trend Day is the opposite: a market in pure imbalance. The market opens and moves strongly in one direction, extending far beyond the Initial Balance. This signals that either buyers or sellers are in complete control.
- Characteristics: Long, thin profile with little price overlap.
- What it means for you: Trend-following is the only viable strategy. Attempting to fade the move is extremely risky. The goal is to join the dominant momentum. A strong break of the IB with high volume is an early signal.
Double-Distribution Day
This occurs when the market establishes one value area, then a significant event causes a sharp price move, leading to the formation of a second, separate value area later in the day.
- Characteristics: The profile shows two distinct high-volume areas separated by a low-volume zone.
- What it means for you: This signals a fundamental shift in the market's perception of value. The low-volume area between the two distributions often becomes a critical support or resistance level in subsequent sessions.
Practical Trading Setups Using Market Profiles
Theory is one thing; practice is another. Here are two concrete trading setups based on Market Profile principles. Remember, these are frameworks, not guarantees. Always apply your own risk management rules, as trading involves a risk of loss.

Setup 1: Fading the Value Area Extremes
This mean-reversion strategy works best on balanced "Normal Days." The idea is that prices at the Value Area High (VAH) are perceived as too expensive, and prices at the Value Area Low (VAL) are too cheap, pulling the market back toward the Point of Control (POC).
Step-by-Step Execution:
- Identify a Balanced Day: Look for a developing symmetrical, bell-shaped profile where price respects the Initial Balance.
- Wait for a Test: Let price reach the VAH or VAL.
- Look for Rejection: Your trigger is evidence that the auction is failing at the extreme. This could be a long candlestick wick, dying momentum, or order flow showing absorption.
- Entry and Risk Management:
- Entry: Enter short near the VAH or long near the VAL after seeing clear rejection.
- Stop-Loss: Place your stop just outside the session's high (for shorts) or low (for longs).
- Target: The POC is the primary target. The opposite side of the value area can be a secondary target.
Setup 2: Trading the Breakout and Acceptance
This setup is for imbalanced "Trend Days." Instead of betting on a return to value, you're betting that the market is successfully establishing a new value area. The key is to distinguish a genuine breakout from a fake-out.
Step-by-Step Execution:
- Identify Imbalance: Look for price moving decisively out of the established value area with strong volume.
- Wait for Acceptance: This is crucial. Price must hold outside the old value area and begin building volume at the new levels (e.g., two consecutive 30-minute bars closing outside).
- Enter on a Retest: The highest-probability entry is often on a pullback to the edge of the old value area (old VAH becomes new support, or old VAL becomes new resistance).
- Entry and Risk Management:
- Entry: Enter in the direction of the breakout when price retests the old boundary and holds.
- Stop-Loss: Place your stop back inside the previous value area. If price is accepted back inside, the trade idea is likely invalid.
- Target: Use a measured move objective or a fixed risk-to-reward multiple like 2:1 or 3:1.
These setups are grounded in the logical behavior of the market as an auction. Research has shown that the double auction model is incredibly efficient (90-99%) at discovering value, even with inexperienced participants. This reinforces the idea that our job is not to outsmart the market but to read the story the auction is telling us. You can explore the research on auction market efficiency for more details.
Applying Auction Theory to Funded Account Rules
Trading a funded account requires precision and strict risk management. Auction Market Theory provides a logical, data-driven framework that aligns perfectly with these requirements. The Value Area High (VAH) and Value Area Low (VAL) offer statistically significant zones to define your risk, helping you stay within your firm’s drawdown limits.
By identifying the market state (balanced or imbalanced), you can select the appropriate strategy and avoid overtrading.
- On Balanced Days: Wait for mean-reversion setups at the VAH or VAL. This provides clear entry points with defined risk.
- On Imbalanced Days: Trade with the momentum by looking for breakouts that find acceptance, aligning your trades with the dominant market force.
A Practical Checklist for Funded Traders
Use this checklist to apply auction market principles to your funded account trading plan:
- Define the Value Area: Before trading, identify the current session's VAH, VAL, and POC.
- Assess the Market State: Is the market balanced (Normal Day) or imbalanced (Trend Day)? Match your strategy to the environment.
- Place Stops Logically: Use the VAH and VAL as primary guides for stop-loss placement to keep risk defined. Understanding different drawdown types is also key; you can learn more about trailing drawdown in our detailed guide.
- Set Realistic Targets: Aim for the POC in a balanced market. In a trending market, use measured moves or risk-reward multiples.
This structured process helps remove emotion and enforces the discipline needed to succeed. The logic of Auction Market Theory is so robust it has influenced Nobel Prize-winning economic research. You can read more about in the official scientific background.
FAQ: Your Top Auction Market Theory Questions
Here are answers to some of the most common questions traders have when starting with Auction Market Theory.
What software do I need to use Market Profile?
You likely don't need specialized software. Many popular charting platforms offer Market Profile or Volume Profile indicators.
- TradingView: Offers many free and paid volume profile indicators.
- Sierra Chart: A long-time favorite for serious profile traders due to its high level of customization.
- ATAS Order Flow Trading: A specialized platform for in-depth order flow and volume analysis.
Start with your current platform to see what options are available before investing in a new tool.
Isn't this just a complex way to draw support and resistance?
No. While VAH and VAL can act like support and resistance, they are fundamentally different. Traditional support and resistance are based on historical price points. The Value Area is calculated from live volume and time-at-price data, showing where the market is currently finding agreement. It's a dynamic concept, not a static line.
Does Auction Market Theory work for forex and crypto?
Yes. Auction Market Theory applies to any market driven by a two-way auction, including forex, crypto, stocks, and futures. The underlying principle is analyzing collective human behavior—the search for a fair price—which is universal across all markets. You may need to adjust for different session times and liquidity, but the core concepts of balance and imbalance remain the same.
How is Market Profile different from a standard volume indicator?
A standard volume indicator on a candlestick chart shows you the total volume traded during a specific time period (e.g., one hour). A Volume Profile or Market Profile shows you the volume traded at specific price levels over a session. This allows you to see where value is being built, which is a much more powerful insight.
Ready to apply a more structured approach to your trading? At MyFundedCapital, we provide the capital and tools for disciplined traders to prove their edge. Our funded accounts come with realistic rules that reward a methodical process.
Compare our funding programs and find the right fit for your strategy.