
 NL
NL  DE
DE 
Trading the tick offers a raw, unfiltered view of market activity, revealing momentum shifts that standard time-based charts often miss. This guide explains how to use tick charts to identify high-probability scalping opportunities and manage the fast-paced risks involved. You will learn practical strategies, the necessary tech setup, and how to apply disciplined risk management.
What is Trading the Tick?
If you're used to 1-minute or 5-minute charts, tick charts can feel strange. Time-based charts print a new candle every sixty seconds, regardless of market activity. This means a new bar forms whether a hundred trades happened or a hundred thousand, which can create significant noise when the market is slow.
Trading the tick is different. Instead of time, new bars are formed based on a specific number of transactions. This approach aligns your chart directly with market participation.
- During high activity, like a major news release, a tick chart prints bars rapidly, giving you a high-definition view of the action.
- During quiet periods, like the midday lull, the chart slows down, naturally filtering out low-volume chop that can trigger false signals.
Essentially, you stop watching the clock and start watching the actual flow of trades entering the market.
The Scalper's Edge on Tick Charts
For scalpers who aim to capture small, quick price moves, tick charts can be a significant advantage. They show you precisely where the real action is happening. You can see the pace of trading accelerate, which often signals that institutional traders are stepping in just before a breakout. This focus on pure price and volume is a core concept in many forex technical analysis strategies.
The infographic below highlights the fundamental difference between how tick and time-based charts interpret the same market data.
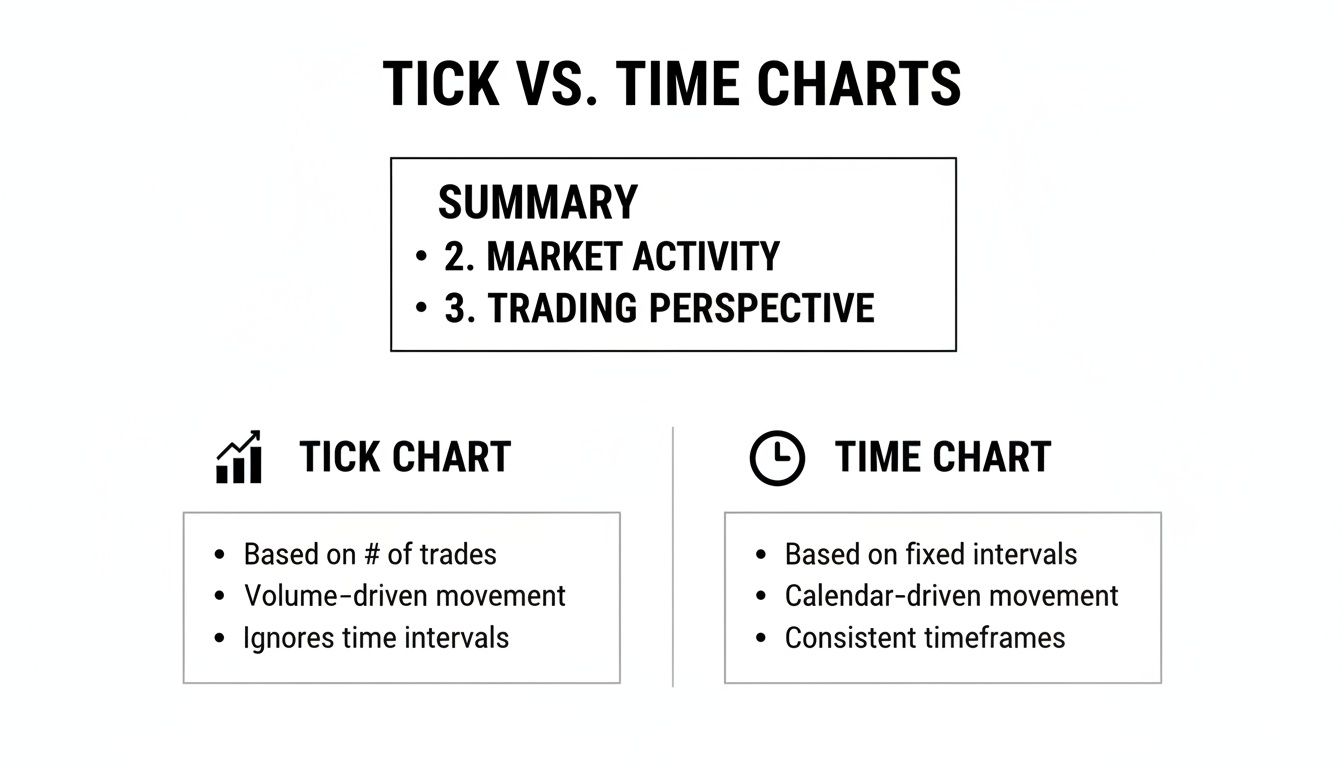
As you can see, tick charts provide a clearer picture of market momentum by expanding during high activity and compressing during lulls. This direct link to transaction flow is why many professional day traders rely on them.
Tick Charts vs. Time-Based Charts
This table breaks down the fundamental differences between tick and time-based charts to help you decide which is better suited for your trading style.
| Feature | Tick Charts | Time-Based Charts (e.g., 1-Minute) |
|---|---|---|
| Bar Formation | Based on a fixed number of transactions (ticks). | Based on a fixed interval of time. |
| Market View | Shows market activity and participation. | Shows market movement over time. |
| During High Volume | Prints bars quickly, offering more detail. | Prints one bar per interval, regardless of volume. |
| During Low Volume | Prints bars slowly, filtering out market noise. | Continues to print bars, often creating choppy price action. |
| Best For | Scalping, momentum trading, identifying volatility. | Trend following, swing trading, longer-term analysis. |
Choosing between chart types comes down to what information you need to make effective trading decisions. For example, active futures traders often use settings like a 100-tick or 200-tick chart. In a high-volume session, a 100-tick chart might produce thousands more bars than a standard 1-minute chart, offering far more potential trade signals.
Building Your High-Speed Trading Toolkit
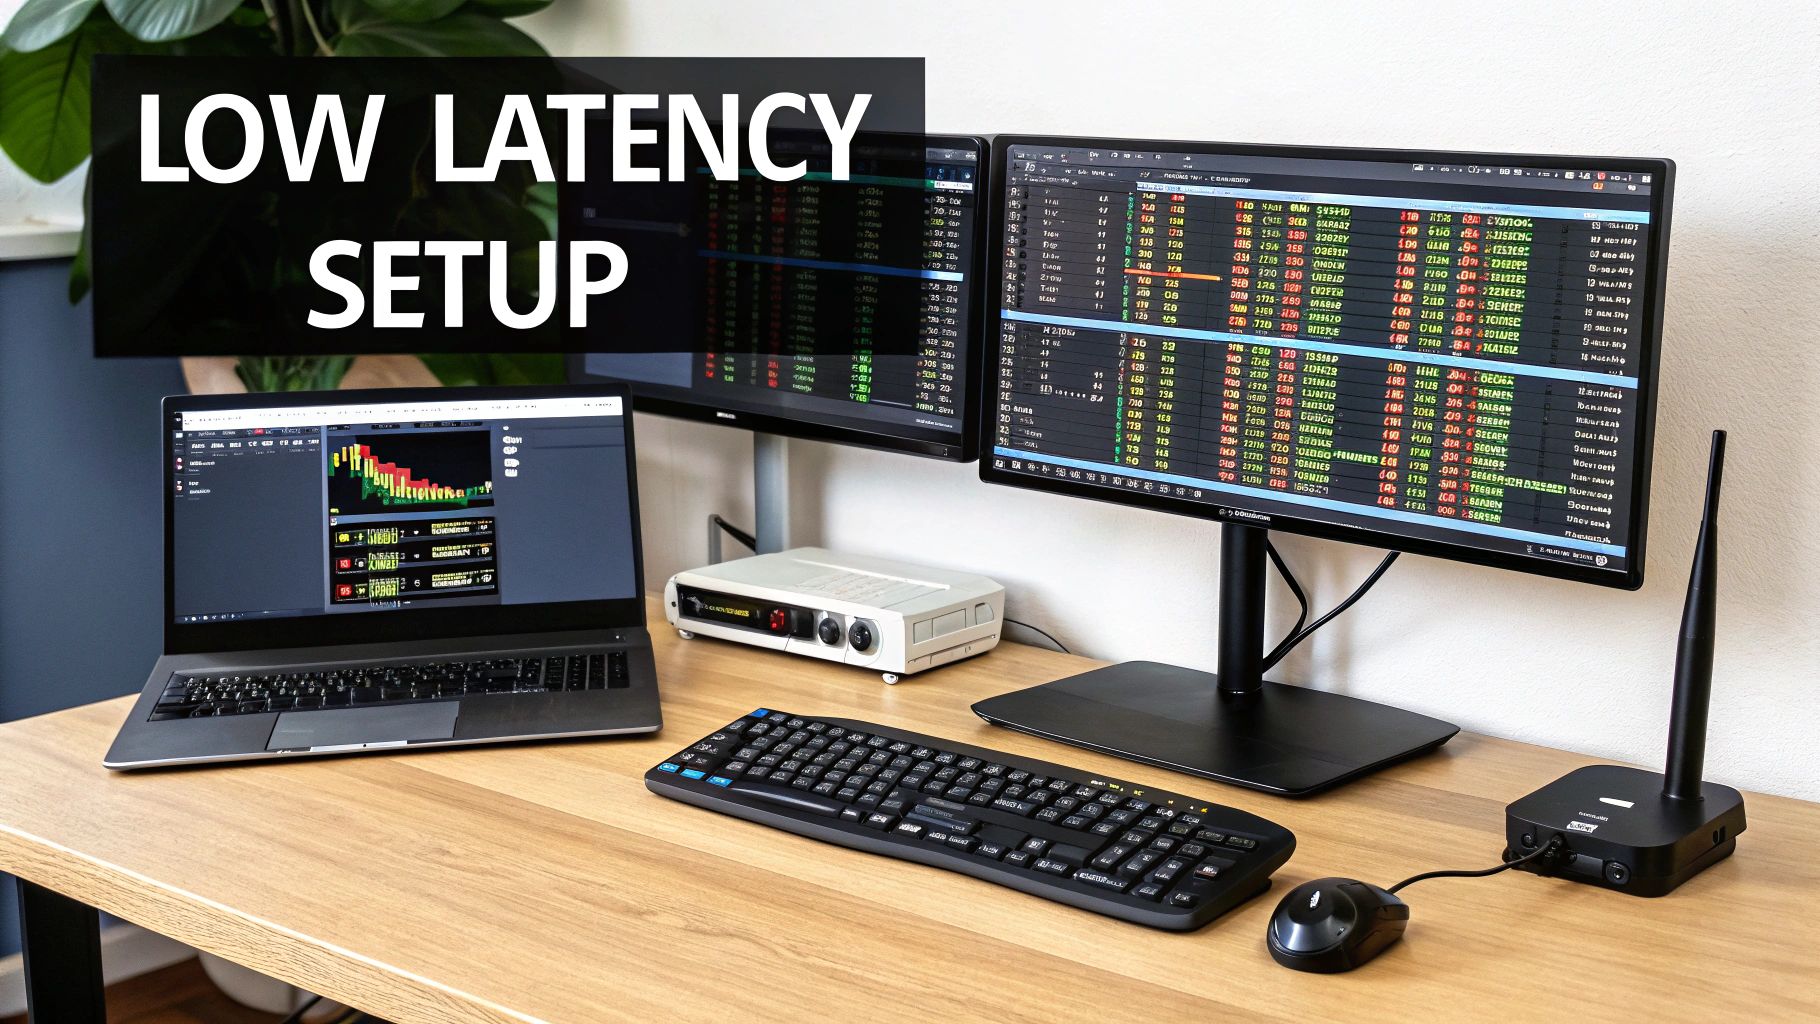
Trading ticks without the right technology is like entering a Formula 1 race with a standard car. The market moves in microseconds, and any lag in your setup puts you at a disadvantage. An efficient toolkit is essential to ensure your execution is as sharp as your strategy.
Your trading platform is the heart of your operation. For high-frequency tick trading, you need a platform built for speed and reliability. Platforms like cTrader and DXtrade, which we provide at MyFundedCapital, are engineered for the demands of scalpers. They offer direct market access (DMA) and are built on low-latency infrastructure—a non-negotiable feature for tick trading.
Core Components of Your Tech Stack
A fast platform is just one piece of the puzzle. Your entire technology chain, from your internet provider to the broker's server, must be optimized. A single weak link can introduce lag, leading to slippage and missed entries.
Here are the essential components you need:
- A Low-Latency Data Feed: This is your window to the market. A slow feed means you are seeing what has already happened, making your tick charts ineffective.
- Fast and Reliable Internet: A stable, high-speed fiber optic connection is the minimum requirement. Avoid using Wi-Fi, as its unpredictable latency is a major risk for scalpers.
- A Capable Trading PC: A computer with a modern multi-core processor and at least 16GB of RAM is critical. You don't want your platform freezing during a key market event.
Why a Virtual Private Server (VPS) is a Game Changer
Even with a perfect home setup, the physical distance between you and your broker's servers creates a delay. For a tick scalper, a few milliseconds can be the difference between profit and loss. This is where a Virtual Private Server (VPS) becomes a powerful tool.
A VPS is a remote computer that runs your trading platform 24/7. The key is to choose a VPS provider with data centers located in the same facility as your broker's servers (e.g., major financial hubs like London or New York).
This "co-location" can slash your execution latency from over 100 milliseconds down to under 5 milliseconds. This is a massive advantage that helps eliminate slippage and ensures your market orders are filled at the price you see. A VPS also acts as a backup against local internet or power outages. Many sophisticated indicators, such as VWAP, also depend on timely data, as explained in our guide on what is VWAP.
Actionable Tick Chart Scalping Strategies
Trading off tick charts requires strategies that are as fast and precise as the data itself. Standard time-based approaches are often too slow to react to the rapid transaction flow revealed by tick charts. Let's break down two practical scalping strategies with clear rules for entry, exit, and risk management.
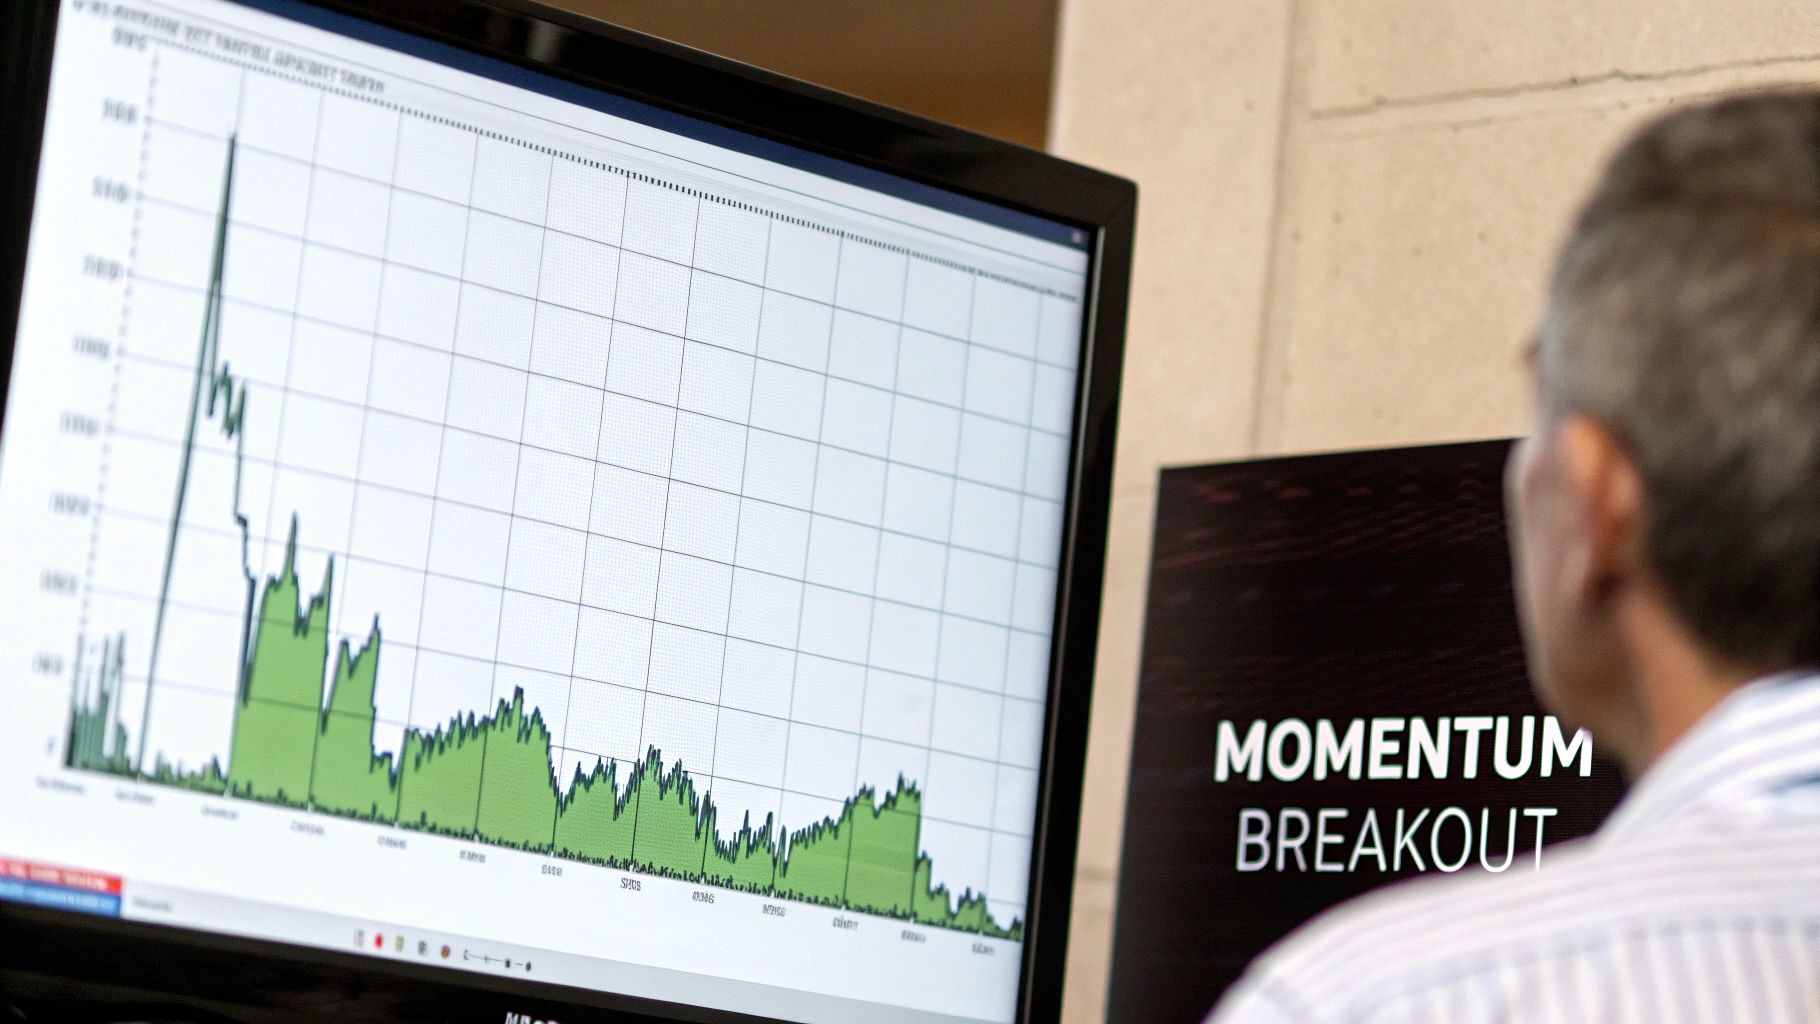
Strategy 1: The Momentum Breakout
This strategy aims to catch explosive moves that emerge from quiet, consolidating periods. On a tick chart, these consolidations appear as tightly packed, sideways bars, showing a temporary balance between buyers and sellers. The breakout occurs when one side gives in, and the goal is to ride that initial burst of momentum.
Checklist:
- Instrument: High-liquidity markets like EUR/USD or S&P 500 E-mini futures (ES).
- Chart Type: A 233-tick chart is a common starting point favored by many tick traders.
- Indicator: A 20-period Exponential Moving Average (EMA) to identify the immediate trend.
Entry Rules:
- Find Consolidation: Identify a period where 233-tick bars form a tight, narrow channel.
- Confirm Trend: For a long trade, the 20 EMA must be sloping up. For a short trade, it must be sloping down. Do not trade if the EMA is flat.
- Execute on Break: Enter with a market order as a candle closes decisively outside the consolidation range, in the direction of the trend. For example, if the trend is up, buy as a candle closes above the range's high.
- Set Stop-Loss: Place your stop-loss just below the low of the consolidation range (for longs) or just above the high (for shorts).
- Take Profit: Aim for a risk-to-reward ratio of at least 1.5:1.
Strategy 2: The Volume Climax Reversal
This counter-trend strategy looks to fade a move that has run out of steam. A volume climax on a tick chart is a dramatic event where you see a series of very long bars printing rapidly, signaling a final burst of panic or euphoria. This often indicates that a short-term reversal is imminent.
Checklist:
- Instrument: Works well on more volatile pairs like GBP/JPY or stock indices during active sessions.
- Chart Type: A 610-tick chart can help smooth out minor noise and make a true climax pattern more obvious.
- Indicator: Volume, to confirm the spike in transaction activity.
Entry Rules:
- Spot the Climax: Look for a sharp, accelerating price run with several consecutive, unusually long bars.
- Confirm with Volume: The volume indicator must show a massive spike, well above the recent average, confirming a rush of participation.
- Wait for the Stall: This is critical. Do not enter prematurely. Wait for the first bar that fails to make a new high (for a short) or a new low (for a long). This signals that the momentum is fading.
- Execute the Fade: Enter on the close of that "stall" bar, trading against the climax move.
- Set Stop-Loss: Place your stop just beyond the peak of the climax move.
- Take Profit: Target a nearby support or resistance level or use a fixed risk-to-reward ratio.
Remember, all trading involves significant risk of loss. These strategies are educational examples and are not financial advice. Always backtest any strategy thoroughly before trading with real capital.
Managing Risk: The Prop Firm Scalper's Rulebook
When trading ticks, both gains and losses can accumulate quickly. In a prop firm environment, managing this risk is critical to staying in the game. One emotional mistake or oversized trade can breach your drawdown limits in minutes, ending your challenge. Your primary job is not to find winning trades, but to protect your capital.
Step 1: Define Your Risk Per Trade
You must decide exactly how much you are willing to lose on a single trade. For high-frequency scalping, a fixed percentage is the most effective way to maintain discipline. A common rule is to risk no more than 0.25% to 0.50% of your account balance per trade.
Example for a $100,000 funded account:
- Account Size: $100,000
- Risk Per Trade: 0.25%
- Maximum Dollar Loss Per Trade: $100,000 * 0.0025 = $250
This $250 is your hard limit for any single trade.
Step 2: Calculate Your Position Size
Once you know your maximum dollar risk, you must translate it into a position size for the instrument you are trading. This prevents you from accidentally taking a position that is far larger than your plan allows.
The formula is:
Position Size = (Max Dollar Risk) / (Stop Loss in Ticks * Tick Value)
Example with E-mini S&P 500 (ES) futures:
- Max Dollar Risk: $250
- Stop Loss: 4 ticks
- Tick Value: $12.50 per contract
Position Size = $250 / (4 ticks * $12.50) = $250 / $50 = 5 contracts
For this setup, you can trade 5 ES contracts and stay within your 0.25% risk limit. If your stop-loss needed to be wider, you would have to reduce your position size accordingly.
Step 3: Set Personal "Circuit Breakers"
Your risk-per-trade rule must operate within the prop firm's daily and maximum drawdown limits. Think of these as the absolute boundaries you cannot cross. To ensure you never get close, implement your own personal daily limits.
Practical circuit breakers include:
- Consecutive Loss Rule: Stop trading for the day after 3 or 4 consecutive losses. This prevents a minor slump from turning into a major drawdown.
- Daily Loss Threshold: If your account is down 2% on the day, walk away. This creates a safe buffer and ensures you never approach the firm's daily loss limit.
This disciplined approach is what separates consistently funded traders from those who fail challenges. It's about long-term survival, which gives your strategy the time it needs to perform.
Frequently Asked Questions (FAQ)
How do I choose the right tick setting for my chart?
There is no single "best" tick setting. The ideal number depends on the instrument's volatility and liquidity. Start with a common setting like 233 or 610 and adjust based on what you see. If the chart is too fast and noisy, increase the tick count. If it's too slow and missing moves, decrease it. The goal is to find a setting that clearly displays consolidations and breakouts for the market you are trading.
Can I trade ticks on any financial instrument?
No. Tick trading is only suitable for highly liquid markets with tight spreads and high volume. Attempting to scalp illiquid instruments will result in high costs (spreads and slippage) and unreliable chart patterns. Stick to major forex pairs (EUR/USD, GBP/USD), major indices (S&P 500, NASDAQ), and major commodities (Gold, Crude Oil).
Is tick trading better than using time-based charts?
Neither is inherently "better"; they are different tools for different jobs. Tick charts are designed for scalpers who need a detailed view of market activity and momentum. Time-based charts are better suited for swing traders and long-term investors who need to identify broader trends over time. The best chart type depends entirely on your trading strategy and timeframe.
What is the biggest mistake new tick traders make?
The most common mistake is over-trading. Because tick charts move quickly, it's easy to get drawn into trading every minor price fluctuation. Successful tick trading still requires patience and discipline to wait for high-probability setups that align with your strategy.
Ready to apply your knowledge with the support of a leading prop firm? MyFundedCapital provides the advanced platforms, low-latency environment, and fair rules you need to succeed as a tick trader.
Explore our funded account programs and start your trading challenge today.