
 EN
EN  DE
DE 
Spotting reliable trade setups in the chaotic forex market can feel like guesswork. Chart patterns offer a solution by revealing the visual story of supply and demand, helping you anticipate potential price moves instead of just reacting. This guide will teach you how to identify the most common continuation and reversal patterns, giving you a practical framework for building a trading plan.
Reading the Market's Story Through Chart Patterns
Think of the forex market as a constant battle between buyers and sellers. Chart patterns are the recurring formations that show you who is winning that battle, providing clues about where the price might go next. Instead of seeing a random series of price bars, patterns help you identify potential turning points or confirmations that a trend is likely to continue.
This is not a magic formula for guaranteed profits. It’s a method for using historical price action to make more informed trading decisions. Learning to spot these patterns allows you to define entry points, set logical stop-losses, and establish profit targets—the core components of a disciplined trading strategy. Remember, trading involves a significant risk of loss, and this content is for educational purposes only, not financial advice.
The Two Main Types of Chart Patterns
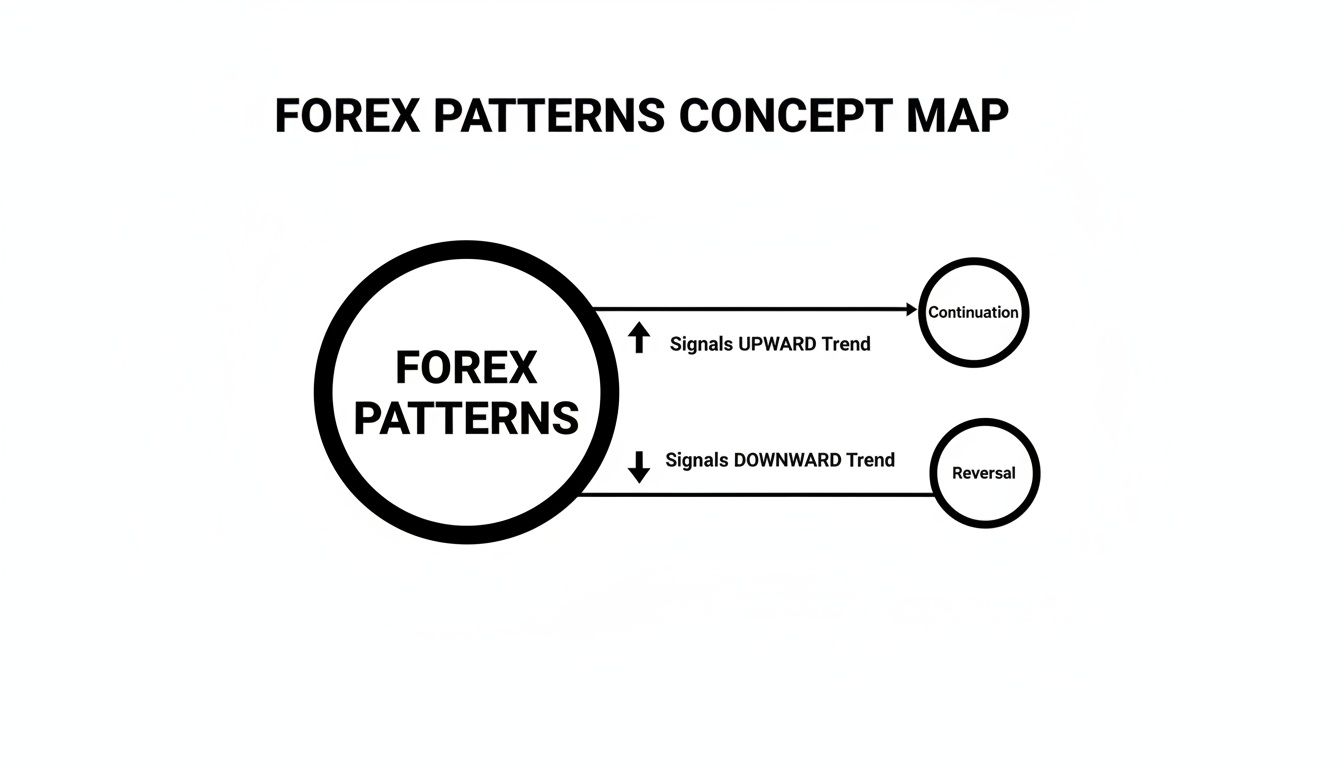
Chart pattern analysis boils down to answering one of two questions: Is the current trend likely to continue, or is it showing signs of reversing?
All chart patterns fall into one of two categories that help answer this: continuation or reversal.
- Continuation patterns (like flags, pennants, and rectangles) suggest the market is taking a brief pause before resuming its original direction.
- Reversal patterns (like the head and shoulders or double tops) signal that the current trend is losing momentum and may be about to change direction.
To understand how these patterns fit into a broader strategy, review our guide on technical analysis trading tips and charting trends.
Here is a simple breakdown to help you distinguish between the two categories.
Reversal vs. Continuation Patterns at a Glance
| Characteristic | Reversal Patterns | Continuation Patterns |
|---|---|---|
| Market Signal | The current trend is likely ending and changing direction. | The current trend is pausing but likely to resume. |
| Trader's Mindset | "Is this the top/bottom? I'm looking for a new trend." | "The trend is strong. I'm looking for a place to join in." |
| Volume Clue | Volume often fades during the pattern, then surges on the breakout. | Volume tends to decrease during the consolidation and then pick up on the breakout. |
| Common Examples | Head & Shoulders, Double/Triple Tops & Bottoms, Wedges | Flags, Pennants, Triangles (Symmetrical, Ascending, Descending), Rectangles |
This table acts as a quick reference. When you see a pattern forming, comparing it against these characteristics can help you frame your trade idea and anticipate the next potential move.
For more examples, you can explore other resources on forex chart patterns on OANDA.com. Next, we’ll examine the most common patterns from each category in detail.
How to Spot and Trade Major Reversal Patterns
Identifying the end of a trend is a difficult but potentially rewarding skill. Reversal patterns are your primary tool for this, signaling that momentum is fading and a significant shift in direction could be imminent. Let's break down three of the most common reversal formations.
This map shows the core distinction: your first task is to determine if you are looking for an end to the current trend (reversal) or just a pause (continuation).
The Head and Shoulders Pattern
The Head and Shoulders is a classic bearish reversal pattern that often signals the end of an uptrend. It consists of a central peak (the head) flanked by two lower peaks (the shoulders). This structure visually represents buyers failing to push the price to new highs, indicating that sellers are gaining control.
The pattern is confirmed by the neckline, a support line drawn connecting the low points between the head and shoulders. A decisive break and close below this neckline is the traditional entry signal, suggesting the uptrend has failed and a downtrend may be starting.
Key Insight: The Head and Shoulders pattern unfolds over a period of time, representing a gradual shift in market sentiment from bullish to bearish. This slow development can make its signals more reliable than sudden price spikes.
Here is an example of a Head and Shoulders pattern on a cTrader chart with the key components marked.
Notice the price breaking and closing below the neckline. This is the confirmation traders often wait for before considering a short position.
Trading the Head and Shoulders: A Step-by-Step Checklist
Here is a practical checklist for trading this pattern:
- Entry Signal: Enter on a candle close below the neckline. This confirms the breakdown. A more conservative entry is to wait for a retest of the broken neckline, which should now act as resistance.
- Stop-Loss Placement: Place your stop-loss just above the right shoulder. If the price moves back to this level, the bearish pattern is invalidated, and the stop-loss exits the trade to limit potential losses.
- Profit Target: To set a target, measure the vertical distance from the top of the head to the neckline. Project this distance downward from the breakout point. This "measured move" provides a potential target, but it's a guideline, not a guarantee.
The Double Top and Double Bottom
Double Tops and Double Bottoms are simpler reversal patterns. They represent a clear test of a support or resistance level, followed by a failure to break through.
- A Double Top forms an "M" shape after an uptrend. The price hits a resistance level, pulls back, and then fails to break that same resistance level on a second attempt. The pattern is confirmed when the price breaks below the support level (the trough) between the two peaks.
- A Double Bottom forms a "W" shape after a downtrend. The price finds support, bounces, and then successfully retests that same support level. The signal to go long occurs when the price breaks above the resistance level (the peak) between the two troughs.
While no pattern is foolproof, some have demonstrated historical reliability. A 2008 study on stock charts found the double top pattern had a success rate of 73%. Although market conditions differ, the underlying psychology of a failed breakout attempt is universal. You can explore these findings and other pattern statistics on JustMarkets.com.
Trading the Double Bottom: A Practical Example
Let's walk through a hypothetical trade on a Double Bottom pattern.
- Identification: On the EUR/USD 4-hour chart, a downtrend stalls. The price hits support at 1.0750, bounces to 1.0800, then drops back to 1.0750 and holds. You now have a Double Bottom. The resistance at 1.0800 is the neckline.
- Entry: You enter a long position after a candle closes above the 1.0800 neckline, confirming that buyers have taken control.
- Stop-Loss: Place a stop-loss at 1.0740, just below the lows of the two troughs. If this level breaks, the pattern is invalidated.
- Profit Target: The distance from the lows (1.0750) to the neckline (1.0800) is 50 pips. Projecting this distance upward from the entry gives a potential target around 1.0850.
Remember, trading reversal chart patterns in forex is about managing probabilities. Always use proper risk management on every trade.
Trading with the Trend Using Continuation Patterns
While reversal patterns help you spot trend endings, continuation patterns help you join trends that are already in motion. These patterns represent periods of consolidation or brief pauses before the dominant trend resumes.
Learning to identify these formations can provide lower-risk entry points into an established trend. We will cover three of the most common continuation patterns: Flags, Pennants, and Rectangles.

Bullish and Bearish Flags
The flag is one of the most recognizable chart patterns in forex. It consists of a "flagpole" (a strong, sharp price move) followed by a "flag" (a small, rectangular channel that slopes against the initial trend).
- A bullish flag appears after a strong rally. The price then consolidates downward in a tight channel, representing a brief pause before buyers likely push the price higher.
- A bearish flag forms after a steep price drop. The price then drifts upward in a weak channel, signaling a potential continuation of the downtrend. Many traders consider flag patterns to be highly effective, often rating them a 9/10 in terms of reliability.
Trading a Bullish Flag: A Practical Walkthrough
Here’s a step-by-step example using the GBP/USD 1-hour chart:
- Identify the Flagpole: Price rallies 100 pips from 1.2500 to 1.2600. This is your flagpole.
- Map the Flag: The price then consolidates downward within a narrow channel between approximately 1.2580 and 1.2560. Draw two parallel trendlines to define this "flag."
- Entry Signal: The entry trigger is a candle close above the upper trendline of the flag. This signals the breakout. You might enter around 1.2585.
- Stop-Loss Placement: Place a stop-loss just below the low of the flag, for example, at 1.2550. A break below this level would invalidate the pattern.
- Profit Target: A common technique is to measure the height of the flagpole (100 pips) and project that distance upward from the breakout point, giving a potential target near 1.2685.
Pennants: The Sharper Cousin of the Flag
Pennants are similar to flags but form within two converging trendlines, creating a small, symmetrical triangle. This pattern represents market tension building before a potential breakout.
Like flags, pennants follow a strong initial move (the flagpole). Volume is a key confirmation tool: it should decrease significantly as the pennant forms and then increase sharply on the breakout. This indicates the market paused before resuming the trend with conviction.
Key Insight: Pennants are typically short-term patterns that resolve within a few days to two weeks. If a pennant drags on for too long, it may lose its predictive power and become sideways consolidation.
Rectangles: The Sideways Pause
A rectangle, also known as a trading range, forms when the price moves sideways between horizontal support and resistance levels. It represents a temporary balance between buyers and sellers.
- A bullish rectangle forms during an uptrend before the price breaks out to the upside.
- A bearish rectangle forms during a downtrend before the price breaks down through support.
Patience is crucial when trading rectangles. The highest-probability entry occurs after a decisive candle close outside the box, ideally confirmed by an increase in volume.
Comparing Key Continuation Patterns
This table summarizes the distinct features of each continuation pattern.
Key Characteristics of Continuation Patterns
| Pattern | Formation Shape | Typical Volume Behavior | Breakout Expectation |
|---|---|---|---|
| Flag | A small, rectangular channel sloping against the trend. | Decreases during consolidation, spikes on breakout. | In the direction of the initial trend (flagpole). |
| Pennant | A small, symmetrical triangle with converging lines. | Dries up during consolidation, surges on breakout. | In the direction of the initial trend (flagpole). |
| Rectangle | Two parallel, horizontal support and resistance lines. | Tends to be erratic or low, increases on breakout. | In the direction of the preceding trend. |
Trading with the trend is often considered a higher-probability approach. By mastering these continuation patterns, you can develop a structured method for finding entry points within an established market move. However, no pattern is guaranteed to work, and disciplined risk management is essential for long-term trading.
Aligning Pattern Trading with Prop Firm Risk Rules
Identifying a clear chart pattern is only half the job. A perfect setup is useless if a single losing trade violates your prop firm’s drawdown limit and results in disqualification. Your technical analysis must be aligned with the strict risk management required for trading funded capital.
Success as a funded trader depends on preserving capital. Your strategy must be built around the firm’s two most important rules: the daily loss limit and the maximum drawdown. Every trade must be sized to respect these non-negotiable limits.

From Pattern to Position Size: A Practical Example
Let's apply this to a real-world scenario. You are trading a $100,000 account with a 5% daily loss limit, meaning you cannot lose more than $5,000 in a single day.
You spot a bullish flag on the GBP/USD 1-hour chart. Your analysis suggests a logical stop-loss placement 40 pips below your entry point.
Here's how to calculate your position size:
- Set Your Risk Per Trade: First, define your personal risk limit for this single trade. A common professional standard is 1% of your account balance, which is $1,000 on a $100,000 account. This is well within the firm's $5,000 daily limit.
- Know Your Pip Value: For GBP/USD, one standard lot (100,000 units) has a pip value of approximately $10.
- Calculate Your Lot Size: Divide your maximum risk per trade ($1,000) by the total dollar value of your stop-loss distance.
The Math:
- Stop-Loss Distance: 40 pips
- Risk per Standard Lot: 40 pips × $10/pip = $400
- Position Size: $1,000 (Your Max Risk) ÷ $400 (Risk per Lot) = 2.5 standard lots
By trading 2.5 lots, a 40-pip loss will result in a $1,000 loss, respecting your 1% personal rule and keeping you safely away from the $5,000 daily loss limit. For more details, you can learn how to calculate the 5% daily loss limit directly from our rules.
Building a Drawdown Buffer
Effective risk management considers the impact of multiple losses. If your maximum drawdown is 10% ($10,000 on a $100k account), five consecutive 1% losses would put you halfway to violating that rule.
Key Insight: Your position size should be dynamic. After a series of losses, your 1% risk amount should be recalculated based on your new, lower account balance. This practice helps protect you from a dangerous downward spiral.
This disciplined approach is what distinguishes traders who remain funded from those who fail their first evaluation. Every pattern can fail. By linking your position size to your stop-loss and the firm's rules, you create a sustainable trading framework.
Beyond the Basics: Advanced Pattern Trading Insights
Identifying classic patterns is a foundational skill, but professional traders go deeper. The true art of pattern trading lies in analyzing context—the subtle clues that separate high-probability setups from market noise. This means moving beyond simple identification to a more sophisticated analysis.
A key factor is the timeframe. A head and shoulders pattern forming on a daily chart carries more weight than one on a 5-minute chart because it reflects the actions and sentiment of more participants over a longer period.
The Power of Higher Timeframes
Think of patterns on different timeframes like waves in the ocean. A pattern on a lower timeframe is a small ripple, while one on a higher timeframe is a powerful wave.
Experienced traders often use a top-down approach. For example, they might identify a major reversal pattern on the daily chart and then zoom into a 1-hour chart to find a smaller continuation pattern (like a bear flag) for a more precise entry. This technique aligns short-term execution with the dominant, higher-timeframe trend.
Handling a Trader's Biggest Challenge: Pattern Failure
Every trader will experience patterns that fail. A perfect-looking flag pattern might break out, only to reverse and hit your stop-loss. This is a false breakout, and managing it is critical for survival.
A false breakout, or "fakeout," occurs when the price moves past a key level but lacks the momentum to continue. The candle may close back inside the pattern's boundary, or subsequent price bars may reverse aggressively.
Key Takeaway: A breakout is a process, not a single price point. Avoid entering the moment a level is touched. Wait for a convincing candle to close outside the pattern to confirm that real momentum is driving the move.
Adding Confluence with Technical Indicators
Trading chart patterns alone can work, but stacking the odds in your favor by seeking confluence is a more robust approach. Confluence means looking for multiple, independent signals that point to the same conclusion. Indicators are excellent for this.
Use indicators as confirmation tools, not as primary signals. They should support the story that price action is already telling.
- Relative Strength Index (RSI): If you see a double top forming, check the RSI. Bearish divergence (price makes a new high while the RSI makes a lower high) is a powerful confirmation that buying momentum is weakening.
- Moving Averages: If a bullish flag is forming, see if the pattern finds support at a key moving average, such as the 50-period EMA. This adds another layer of evidence that the underlying trend remains intact.
- Volume: A genuine breakout should ideally occur on a significant spike in volume. A breakout on low, weak volume is a red flag suggesting a lack of conviction behind the move.
By combining timeframe analysis, a plan for handling failed patterns, and confirmation from indicators, you build a much stronger trading framework. This layered approach helps you filter out low-quality setups and act with more confidence when a high-probability opportunity arises.
FAQ: Common Questions About Chart Patterns in Forex
Here are answers to some of the most common questions beginner and intermediate traders have about using chart patterns.
Which chart pattern is the most reliable?
No single pattern is 100% reliable because market conditions are always changing. However, major reversal patterns like the Head and Shoulders and Double Tops/Bottoms are often considered highly dependable because they take longer to form and represent a significant shift in market sentiment. Their reliability increases when confirmed by other factors, such as a breakout on high volume or divergence on an indicator like the RSI. Treat chart patterns in forex as a piece of evidence within a complete trading plan, not as a standalone signal.
How can I avoid false breakouts?
While you can't eliminate false breakouts entirely, you can reduce their frequency with patience and confirmation. Instead of entering as soon as a price crosses a trendline, use this checklist:
- Wait for a candle close. A decisive close outside the pattern provides stronger confirmation than a brief price spike.
- Check for high volume. A surge in volume on the breakout indicates strong participation and conviction behind the move.
- Wait for a retest. A more conservative approach is to wait for the price to pull back and retest the broken level before entering. This may mean missing the initial part of the move but can result in a safer entry.
Can I use these patterns on any timeframe?
Yes, chart patterns are fractal, meaning they appear on all timeframes, from one-minute charts to weekly charts. However, their significance varies. A pattern on a daily chart is generally more significant than the same pattern on a 5-minute chart because it reflects the collective actions of more market participants over a longer period.
- Swing and position traders should focus on higher timeframes like the 4-hour and daily charts.
- Day traders and scalpers can use lower timeframes (e.g., 5-minute or 15-minute) but should first identify the dominant trend on a higher timeframe to ensure they are trading with the overall market direction.
Turn Your Pattern Knowledge into a Trading Career
You've learned how to read market structure through chart patterns in forex and, more importantly, how to manage risk like a professional. The next step is to apply these skills in a real-world trading environment without risking your own capital. A proprietary trading firm provides this exact opportunity.
Our funding challenges are designed for traders who prioritize disciplined analysis and risk management. If you're ready to take the next step, our guide on how long it takes to become a funded trader can help you understand the journey. Explore our programs to see how you can get funded and make the transition to professional trading.
Every trade involves a significant risk of loss. However, with a solid plan based on the principles of technical analysis and disciplined risk control, you can approach the markets with the confidence of a professional.
Ready to trade with our capital? At MyFundedCapital, we provide the platform for skilled traders to prove their edge. Compare our funding programs and start your challenge today!