
 EN
EN  DE
DE 
Spotting when a trend is losing momentum is a critical skill for any trader. This guide breaks down two of the most reliable reversal signals—double tops and double bottoms—to help you identify potential shifts in market direction. You'll learn the anatomy of these "M" and "W" shaped patterns and how to build a practical trading strategy around them.
What are double tops and double bottoms?

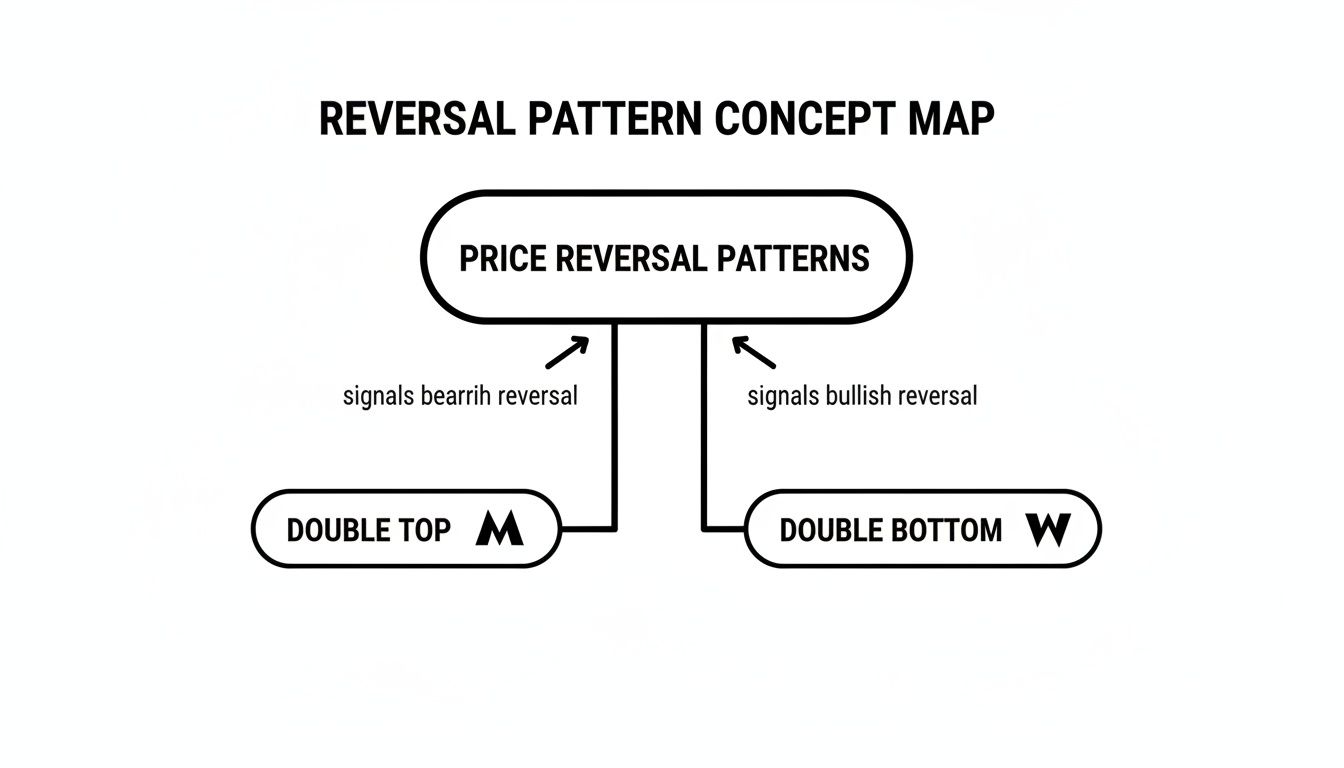
Double tops and double bottoms are chart patterns that signal a potential trend reversal. They tell a story about a battle between buyers and sellers where the dominant side fails to maintain control, leading to a change in direction.
- A double top looks like the letter 'M' and suggests a shift from an uptrend to a downtrend. It forms when the price hits a resistance level, pulls back, and then fails to break that same resistance level on a second attempt.
- A double bottom looks like the letter 'W' and suggests a shift from a downtrend to an uptrend. It occurs when the price finds a support level, rallies, and then fails to break below that same support on a second try.
Understanding the structure of these patterns is the first step to using them effectively.
The Double Top 'M' Formation
A double top is a bearish reversal pattern indicating that an uptrend may be ending. The failure of the price to create a new high on the second peak shows that buying pressure is weakening.
- First Peak: The highest point of the current uptrend, where price meets resistance.
- Trough: Price pulls back from the first peak to a temporary support level.
- Second Peak: Price rallies again but fails to break above the first peak, often on lower volume.
- Neckline: A horizontal line drawn at the low of the trough. A decisive price break below this line confirms the pattern.
The key takeaway is the market's inability to set a higher high, signaling that sellers are starting to take over.
The Double Bottom 'W' Formation
A double bottom is a bullish reversal pattern suggesting a downtrend is losing steam. The price fails to create a new low on the second trough, indicating that selling pressure is drying up.
- First Trough: The lowest point of the current downtrend, establishing a support level.
- Peak: Price rallies from the first trough to a temporary resistance level.
- Second Trough: Price falls again but fails to break below the first trough, typically on lighter volume.
- Neckline: A horizontal line drawn at the high of the peak. A clean price break above this line confirms the pattern.
This pattern shows that buyers are stepping in and defending the support level, signaling a potential move higher. For more context, you can explore our complete guide to chart patterns in forex.
How to trade a double top pattern

Trading a double top requires more than just spotting an 'M' shape. A disciplined approach involves waiting for confirmation, setting clear entry and exit points, and managing risk. Jumping in too early is a common mistake that can lead to unnecessary losses.
Step 1: Confirm the signal
Before placing a trade, look for additional evidence to support the bearish reversal.
- Volume Analysis: Ideally, the first peak forms on high volume, while the second peak forms on lower volume. This suggests fading conviction from buyers. A surge in selling volume as the price breaks the neckline adds strong confirmation.
- Bearish Divergence: Use an oscillator like the Relative Strength Index (RSI). If the price makes two similar highs but the RSI makes a lower high, this bearish divergence indicates weakening upward momentum.
Step 2: Plan your entry and exit
A structured plan is essential, especially when trading with a prop firm's risk parameters.
Entry Triggers
There are two common entry methods:
- Aggressive Entry: Enter a short position as soon as a candle closes decisively below the neckline. This gets you in early but carries a higher risk of a false breakout.
- Conservative Entry: Wait for the price to break the neckline, then pull back to retest it from below. Enter short when the price rejects this old support (new resistance).
Stop-Loss Placement
Set your stop-loss just above the highest peak of the 'M' formation. If the price breaks this level, the bearish pattern is invalidated, and you want to exit the trade with a controlled loss.
Profit Target
Use the measured move technique to set an objective target:
- Measure the vertical distance from the highest peak down to the neckline.
- Project that same distance downward from the neckline breakout point. This projected level is your primary take-profit target.
A full analysis on Lux Algo of historical patterns highlights the importance of proactive profit-taking, as not all patterns reach their full measured target.
How to trade a double bottom pattern
Trading a double bottom involves a similar step-by-step process focused on confirmation and risk management. This 'W' pattern can signal a powerful shift from selling to buying, but patience is required to avoid getting caught in a fakeout.
Step 1: Confirm the signal
Wait for clear signs that sellers are losing control before committing to a long position.
- Volume Analysis: A classic double bottom often shows heavy selling volume on the first trough, followed by lighter volume on the second. This indicates seller exhaustion. Look for a spike in buying volume on the neckline breakout for confirmation.
- Bullish Divergence: Check an oscillator like the RSI. If the price forms two equal lows but the RSI prints a higher low, this bullish divergence suggests that downward momentum is fading.
Step 2: Plan your entry and exit
Define your trade parameters before you enter the market.
Entry Triggers
Choose an entry based on your risk tolerance:
- Aggressive Entry: Go long as soon as a candle closes firmly above the neckline. This offers a potentially better entry price but a higher risk of failure.
- Conservative Entry: Wait for the price to break out and then pull back to retest the neckline from above. Enter long as the price bounces off this old resistance (new support).
Stop-Loss Placement
Place your stop-loss just below the lowest trough of the 'W' formation. A price move below this level invalidates the bullish setup and signals it's time to exit.
Profit Target
Calculate your profit target using the measured move:
- Measure the vertical distance from the lowest trough up to the neckline.
- Project this distance upward from the point where the price broke the neckline. This level serves as your initial take-profit target.
You can learn more about how these patterns appear in major markets to see real-world examples.
Common mistakes to avoid
Recognizing a pattern is only half the battle. Avoiding common trading errors is what helps build consistency.
Here are three frequent mistakes and how to fix them:
- Entering Before Confirmation: Many traders jump in as the second peak or trough is forming, anticipating the reversal.
- The Fix: Wait for a decisive candle to close beyond the neckline. Confirmation is not a suggestion; it's a critical part of the strategy.
- Ignoring Volume: A breakout on low volume is often a trap. It signals a lack of market participation and conviction behind the move.
- The Fix: Always look for a noticeable increase in volume on the neckline break. This confirms that larger players are supporting the move.
- Setting Stops Too Tight: Placing a stop-loss just a few pips beyond the pattern's extreme leaves no room for market noise.
- The Fix: Give your trade space to work. Set your stop a reasonable distance above the double top's peaks or below the double bottom's troughs.
For a deeper dive into charting, check out our guide on technical analysis trading tips and charting trends.
Using these patterns in a prop firm strategy
Applying these patterns within a prop firm challenge requires strict risk management to stay within rules like a 5% daily or 10% maximum drawdown. Your goal is not to hit home runs but to demonstrate a consistent, risk-managed approach.
Let's use a practical example with a $100,000 account:
- Maximum Loss: Your max drawdown is 10% ($10,000).
- Risk Per Trade: You decide to risk 1% ($1,000) on any single trade.
- The Setup: You spot a double bottom on EUR/USD. The distance from your entry (neckline break) to your stop-loss (below the lows) is 40 pips.
- Position Size: To risk $1,000 with a 40-pip stop, your position size would be 2.5 lots.
This calculation ensures that if the trade fails, your loss is contained and you are nowhere near violating the drawdown rules. Profitability in a funded challenge is a direct result of excellent risk management.
FAQ: Double tops and double bottoms
What is the best timeframe for trading these patterns?
Double tops and double bottoms appear on all timeframes, but they are generally more reliable on higher ones (e.g., 4-hour, daily, weekly). A pattern that forms over several days or weeks reflects a more significant shift in market sentiment and often leads to a more substantial price move.
What is the difference between a double top and a triple top?
A triple top is an extension of a double top. Instead of failing twice at a resistance level, the price fails three times. This third failure makes the resistance level appear even stronger and can lead to a more aggressive reversal if the neckline is broken. The same logic applies to triple bottoms.
What should I do if a pattern fails?
Pattern failure is a normal part of trading. A failed double bottom occurs when the price breaks the neckline, only to reverse and fall below the previous lows. This is precisely what your stop-loss is for. By placing it correctly below the pattern's lowest point, a failed setup results in a small, pre-defined loss, protecting your capital.
Ready to apply your knowledge in a real trading environment? MyFundedCapital provides the platform and capital for skilled traders to prove their edge.
Explore our funding programs and start your challenge today!